

Linear model plot#
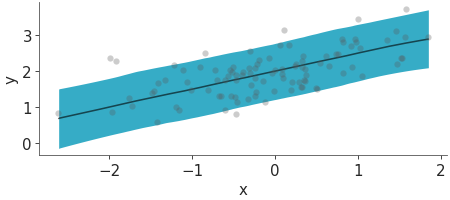
Posterior predictive and mean plots for regression-like data. The plot_lm function
visualizes credible intervals around predictions alongside observed data points.
import numpy as np
from arviz_base import from_dict

import arviz_plots as azp

azp.style.use("arviz-variat")

np.random.seed(42)
x_data = np.random.normal(0, 1, 100)
y_data = 2 + x_data * 0.5 + np.random.normal(0, 0.5, 100)
y_data_rep = np.random.normal(2 + x_data * 0.5, 0.5, (4, 200, 100))

dt = from_dict(
    {
        "posterior_predictive": {"y": y_data_rep},
        "observed_data": {"y": y_data},
        "constant_data": {"x": x_data},
    },
    dims={"y": ["obs_id"], "x": ["obs_id"]},
    coords={"obs_id": range(100)},
)

pc = azp.plot_lm(
    dt,
    backend="none",  # change to preferred backend
)
pc.show()
See also
API Documentation: plot_lm