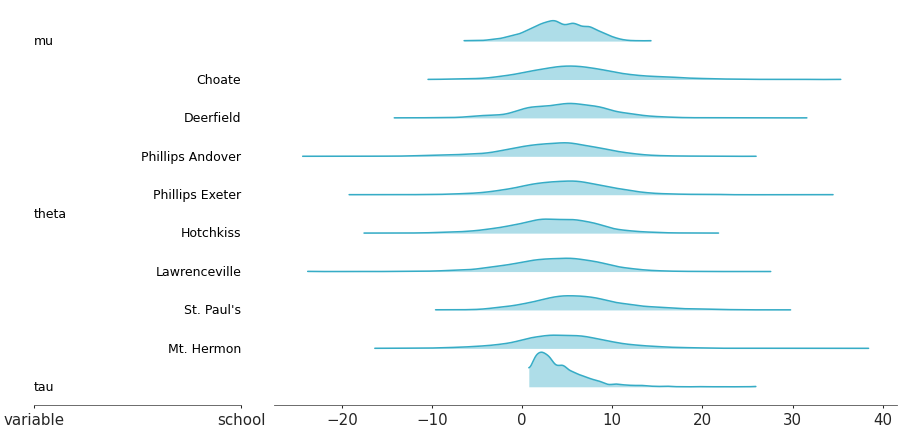

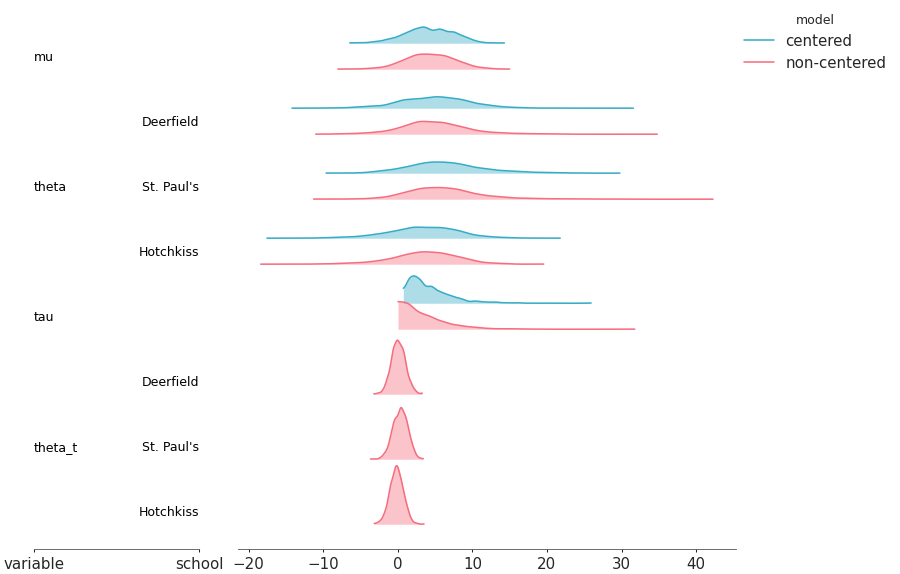
Ridge plot for multiple models#
Visual representation of marginal distributions over the y axis showing for multiple models
from arviz_base import load_arviz_data
import arviz_plots as azp
azp.style.use("arviz-variat")
centered = load_arviz_data("centered_eight")
non_centered = load_arviz_data("non_centered_eight")
pc = azp.plot_ridge(
{"centered": centered, "non-centered": non_centered},
coords={"school": ["Deerfield", "St. Paul's", "Hotchkiss"]},
backend="none", # change to preferred backend
)
pc.add_legend("model")
pc.show()
See also
API Documentation: plot_ridge
Other examples with plot_ridge#